
The biggest convective clouds are towering structures that can bring significant rainfall. (Photo: Arrangements-Photography/iStock/Thinkstock)
Convection is one of the small-scale atmospheric processes at the heart of the workshop ‘Shedding light on the greyzone’ taking place at ECMWF from 13 to 16 November. Convection specialist Peter Bechtold explains why.
Peter has been interested in weather since he was a child. After an undergraduate course in physics and meteorology, he completed his PhD in 1992.
His interest in convection dates back to his time as a researcher in France in the mid-nineties. He was working on low-level clouds and turbulence when a dramatic flash flood event brought home to him the power of convective processes.
He has been working on the topic for the last 15 years in ECMWF’s Research Department.
“This research area is as exciting as ever, especially now that we are moving towards a horizontal resolution of 5 km in our global atmospheric model. That’s right in the grey zone where convection can be partially resolved by the model, but not fully,” he says.
In his grey zone workshop talk, Peter will discuss some of the convection-related work taking place at ECMWF.
Importance of convection
Convection is the rising of plumes of moist air in response to instability in the atmosphere.
“The instability can be caused by cooling at the top or heating at the bottom. Either process creates deviations from stable conditions in the vertical temperature profile,” Peter explains.
He adds that it all comes down to Archimedes’ principle: a body immersed in a fluid is driven upward by a force equal to the difference between its weight and the weight of the fluid displaced.
The result is that convection is the main process of vertical exchange between the lower and the upper troposphere, in particular of water vapour, heat and chemical species.

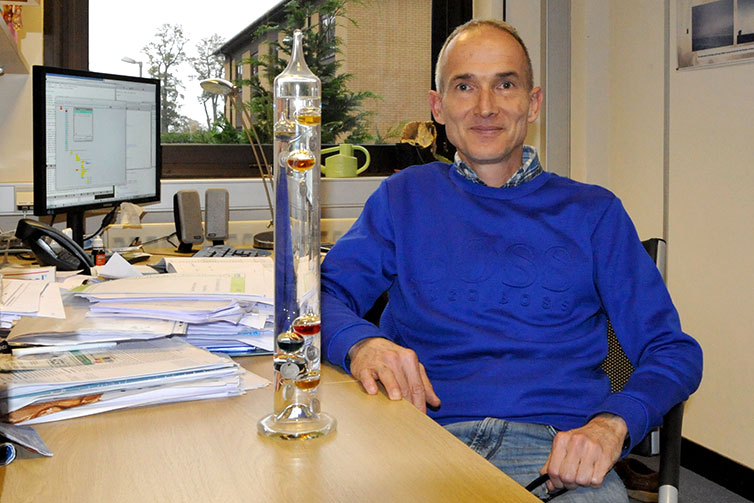
A Galileo thermometer has pride of place in Peter’s office. It exploits Archimedes’ principle: temperature changes affect the density of the outer clear liquid and this causes the differently coloured bulbs, whose weight and volume is fixed, to rise or sink.
Deep convection penetrates to altitudes of about 10 to 15 km at the top of the troposphere and even into the lower stratosphere. The clouds it produces can be towering structures taller than the highest mountains.
Such clouds are typical of the tropics but they are also common in the mid-latitudes. They can produce large amounts of precipitation.
If temperature inversion layers are present lower down in the atmosphere, they give rise to shallower convective clouds, such as cumulus congestus or even shallower cumulus clouds in the lowest part of the atmosphere. The latter type is commonly found in the sub-tropics.
“In the tropics most of the rainfall is convective, while in the mid-latitudes about 40 per cent of precipitation occurs in areas with convective instability,” Peter says.

Shallow, non-precipitating convective clouds form in the atmospheric boundary layer – the lowest part of the atmosphere, whose behaviour is influenced by the surface. (Photo: oticki/iStock/Thinkstock)
Modelling convection
Global numerical weather prediction models divide the atmosphere into millions of grid boxes usually between about 10 to 20 km wide.
Convection takes place on scales which cannot be simulated with such a coarse grid spacing. It is therefore modelled in separate ‘parametrization schemes’.
These schemes use average grid box values from the model to work out the vertical mass transport taking place in every grid box.
This is in turn used to determine the ‘physical tendencies’: the amount by which weather model variables such as temperature, humidity and wind need to be adjusted as a result of subgrid-scale physical processes.
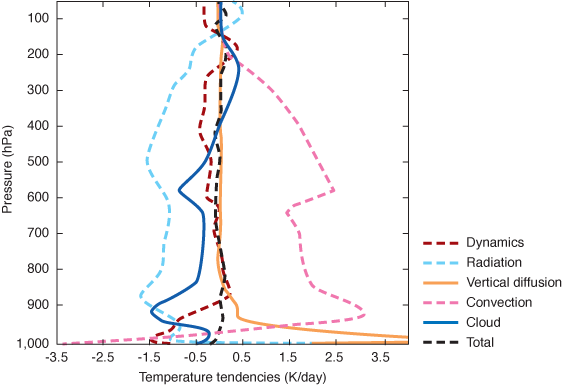
“The importance of convection for the weather is reflected in the size of the physical tendencies produced by convection schemes,” Peter says. “In ECMWF’s Integrated Forecasting System (IFS), convection accounts for about 50 per cent of the total forecast tendencies above the boundary-layer.”

The plot shows the contribution of the different physical parametrization schemes (radiation, vertical diffusion, convection and cloud) and the dynamics to the tendencies for temperature in the IFS at different pressure levels, averaged over the tropics. The black line denotes the total model tendency.
The grey zone of convection
The drive towards higher resolution in global weather models complicates matters a little.
“The equations used in convection schemes assume that there is a state of quasi-equilibrium in every grid box, in other words there is an approximate balance between rising and sinking movements of air,” Peter says.
This does not hold any more at a grid spacing of 5 km or less.
“This is referred to as the grey zone since we don’t yet know how best to represent certain processes at these resolutions. We won’t be able to do this correctly if we just continue as before.”

The difficulties of predicting convective processes even in the short range are illustrated by these mesoscale convective systems over equatorial Africa at 21 UTC on 12 July 2017 as observed by the Meteosat-10 satellite (left). The middle and right-hand panels show 3-hour accumulated precipitation from two members of a 42-hour, 18 km resolution ECMWF ensemble forecast starting at 00 UTC on 11 July 2017 with stochastically perturbed convection parameters.
The way forward
Different options are being explored to address the problem.
One is to introduce time dependence and sophisticated microphysics into the schemes. “Such schemes are complicated and take years to develop,” Peter notes.
Another is to let the global model do all the work and switch the convection parametrization scheme off. This tends to delay the onset of convection and to overestimate the vertical transport.
“My priority is to get the large-scale tropical wave patterns such as the Madden–Julian Oscillation right. This ensures a high degree of predictability in the medium range,” Peter says.
“One pathway is to scale down the convective fluxes as you go towards higher resolution and to further develop the microphysics.”
It may also be possible to connect the physics to the dynamics in neighbouring grid cells, so that information can be spread from one cell to the next.
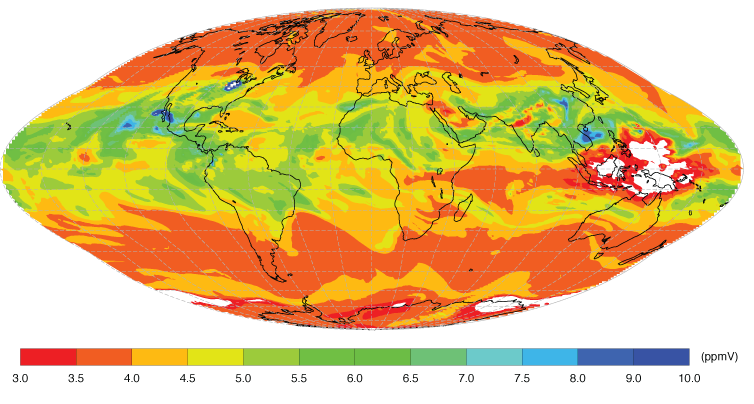
 Convective overshoots are an active area of research as they are the main source of water vapour for the lower stratosphere. The plot shows stratospheric water vapour from the ERA5 climate reanalysis at 21 UTC on 9 July 2013, showing large values related to convective overshoots over the Great Lakes region but also in Central America and the East Asian monsoon region.
Peter’s grey zone workshop presentation will focus on three avenues being pursued at ECMWF.
The first is work to improve the representation of boundary layer convection. “This will be relevant for the next 15 to 20 years,” Peter says.
Efforts are also under way to reduce the underestimation of night-time convection in the Sahel zone and North American spring time.
The third issue is the mixing between the upper troposphere and the lower stratosphere by convective overshoots. “This is the main source of water vapour for the lower stratosphere, but these processes are currently not well represented in the model.”
“The grey zone is a challenge but we are working to tackle it on a number of fronts,” Peter says.
More information on the workshop can be found on the workshop page.
